PERT stands for Program Evaluation and Review Technique; CPM stands for the Critical PathMethod. These are conceptually distinct, but are frequently taught together, as we’ll do here.The PERT and CPM procedures have been greatly expanded and elaborated upon by the projectmanagement profession. These elaborations are essential when projects are vast andcomplicated, and they’re usually supported
...[Show More]
PERT stands for Program Evaluation and Review Technique; CPM stands for the Critical Path
Method. These are conceptually distinct, but are frequently taught together, as we’ll do here.
The PERT and CPM procedures have been greatly expanded and elaborated upon by the project
management profession. These elaborations are essential when projects are vast and
complicated, and they’re usually supported by equally elaborate computer apps. In this module,
many of those elaborations are ignored. The emphasis will be on understanding basic principles.
If a manager remembers those, then he or she will recognize situations in which PERT-CPM
might be useful. Following that recognition, the manager will then go to the Web; either to
review the PERT-CPM procedures or, more likely, to find and hire a consultant.
There are two big questions that PERT-CPM answers. The first is about task length: How long is
something going to take, or analogously, how much is it going to cost? That’s answered by PERT.
The second is about project length: Given a series of interrelated tasks, how long will it take to
get everything done? That’s answered by CPM.
Let’s jump into the discussion with some examples.
PERT
Your company is migrating to a new MIS. You’ve been made the project officer. The CIO needs
to know how many weeks it will take; in particular, she needs one number that she can present
to the Board. “One number!” she tells you. “That’s one, O-N-E. Not a range, not a band, not
some list of numbers along with a list of maybes and what-ifs. One number. And it had better be
on target, or darn close.”
You convene a meeting of the company’s most experienced IT professionals, plus
representatives from the vendor. Three different numbers are heard repeatedly; an optimistic
time (“If everything goes right, we’ll be done in 3 weeks”), a pessimistic time (“But it could take
as long as two months”) and a most likely time. (“Actually, though, I think six weeks would be a
good guess.”) These numbers are helpful, but they’re not the single number the CIO wants from
you.
You consider various options. Obviously, you could take an average of everyone’s most
optimistic numbers, but that average would probably be wrong. You could average the most
pessimistic numbers, but that would probably result in wasted time, since the company would
adjust its schedule to accommodate a project that would, in the end, not take as long as
expected. You could average everyone’s most likely times, but that doesn’t seem right either;
both the optimistic and the pessimistic outcomes are possible, and those numbers should be
incorporated into the estimate in some way.
The PERT solution is goes like this. First, settle on three numbers; optimistic, pessimistic, and
likely. Each of these could be obtained using some sort of group decision process, such as the
Delphi technique. With these three numbers in hand, calculate a single value, a so-called
expected value, in a way that includes the optimistic, pessimistic and most likely values, but puts
the most weight on the most likely value. In PERT, the optimistic and the pessimistic estimates
both get a weight of one; the most likely, a weight of four. Here’s the formula.
Suppose the group decides that the best outcome you could hope for is to be finished in three
weeks. That’s O. But if things get really out of hand, it could take as long as two months, or eight
weeks. That’s P. But it’s most likely the project will be finished by six weeks. That’s L. The
number you want to give to the CIO is the expected completion time, E. That’s
Since 0.83 weeks is 5.8 days, it would probably be a good idea to round that number up to six
weeks. You would, of course, want to tell the CIO that you’ve done that.
TEST YOUR UNDERSTANDING I:
Here’s a table with the pessimistic (P), optimistic (O), and most likely (L) times for three tasks.
Calculate the expected (E) times. The answer is given at the end of the SLP page. Don’t peek!
Time is given in days. Round the expected times up to the nearest whole day. This is reasonable,
since most workers are paid for whole days; if they show up, they get paid.
CPM
One of the few domestic tasks Bill’s wife entrusts him with is fixing breakfast. The menu never
varies; hot oatmeal with cinnamon and raisins, buttered toast, hot tea and OJ.
Over the years, Bill has observed that the two activities that take the most time are heating the
two bowls of oatmeal in the microwave. (If a bowl isn’t on the middle of the turntable, it boils
over. So he has to cook the bowls separately.) That takes 5 minutes 30 seconds per bowl, for a
total of 11 minutes. Moving the various ingredients from the cupboard and fridge to the
counter, and fixing the first bowl, takes two minutes; swapping the bowls in the microwave after
the first one is finished takes 20 seconds. Taking the food to the table takes another 20 seconds.
These tasks—setting up, cooking the oatmeal, and serving—have to be done in sequence.
Everything else in the breakfast routine, such as pouring the OJ, making and buttering the toast,
making the tea and putting stuff back into the fridge, can be done while the oatmeal is in the
microwave.
That sequence of events—setup, cooking the oatmeal, and serving—is the critical path. If Bill
wants to get breakfast on the table more quickly, he’ll have to find some way to shorten one or
more of the tasks on that path. One possible solution would be to buy a microwave that only
needs three minutes to cook a bowl of oatmeal, instead of five and a half minutes.
Let’s formalize that idea.
Suppose a project consists of eight tasks, labeled A through H. Each task takes a certain amount
of time; that would be its expected time, which we learned how to calculate above. All the tasks
have to be completed before the project itself is completed, but some tasks have to be finished
before other tasks can go forward (such as getting the breakfast fixings onto the counter before
the first bowl can go into the microwave). The ones that necessarily come before others are
called predecessors.
We begin with a starting point—the point where the clock starts to run. (We’ll leave out the task
times for the moment, and put them in later.) Suppose tasks A and B go first; they have no
predecessors, and they can start at the same time. In the breakfast example, A might be making
the oatmeal, while B is making the tea; Bill can do the first task while his wife does the second,
on the other side of the kitchen.
Let’s make a list of tasks and predecessors, and simultaneously draw a timeline diagram that
runs from left to right.
Task A has to be completed before C can begin; task B has to be completed before D can begin.
That is, A is C’s predecessor, and B is D’s predecessor. Since time runs from left to right, C must
be shown after (to the right of) A, and D must be shown after B.
Let’s assume that C is the predecessor for both F and E, while both D and E are predecessors G.
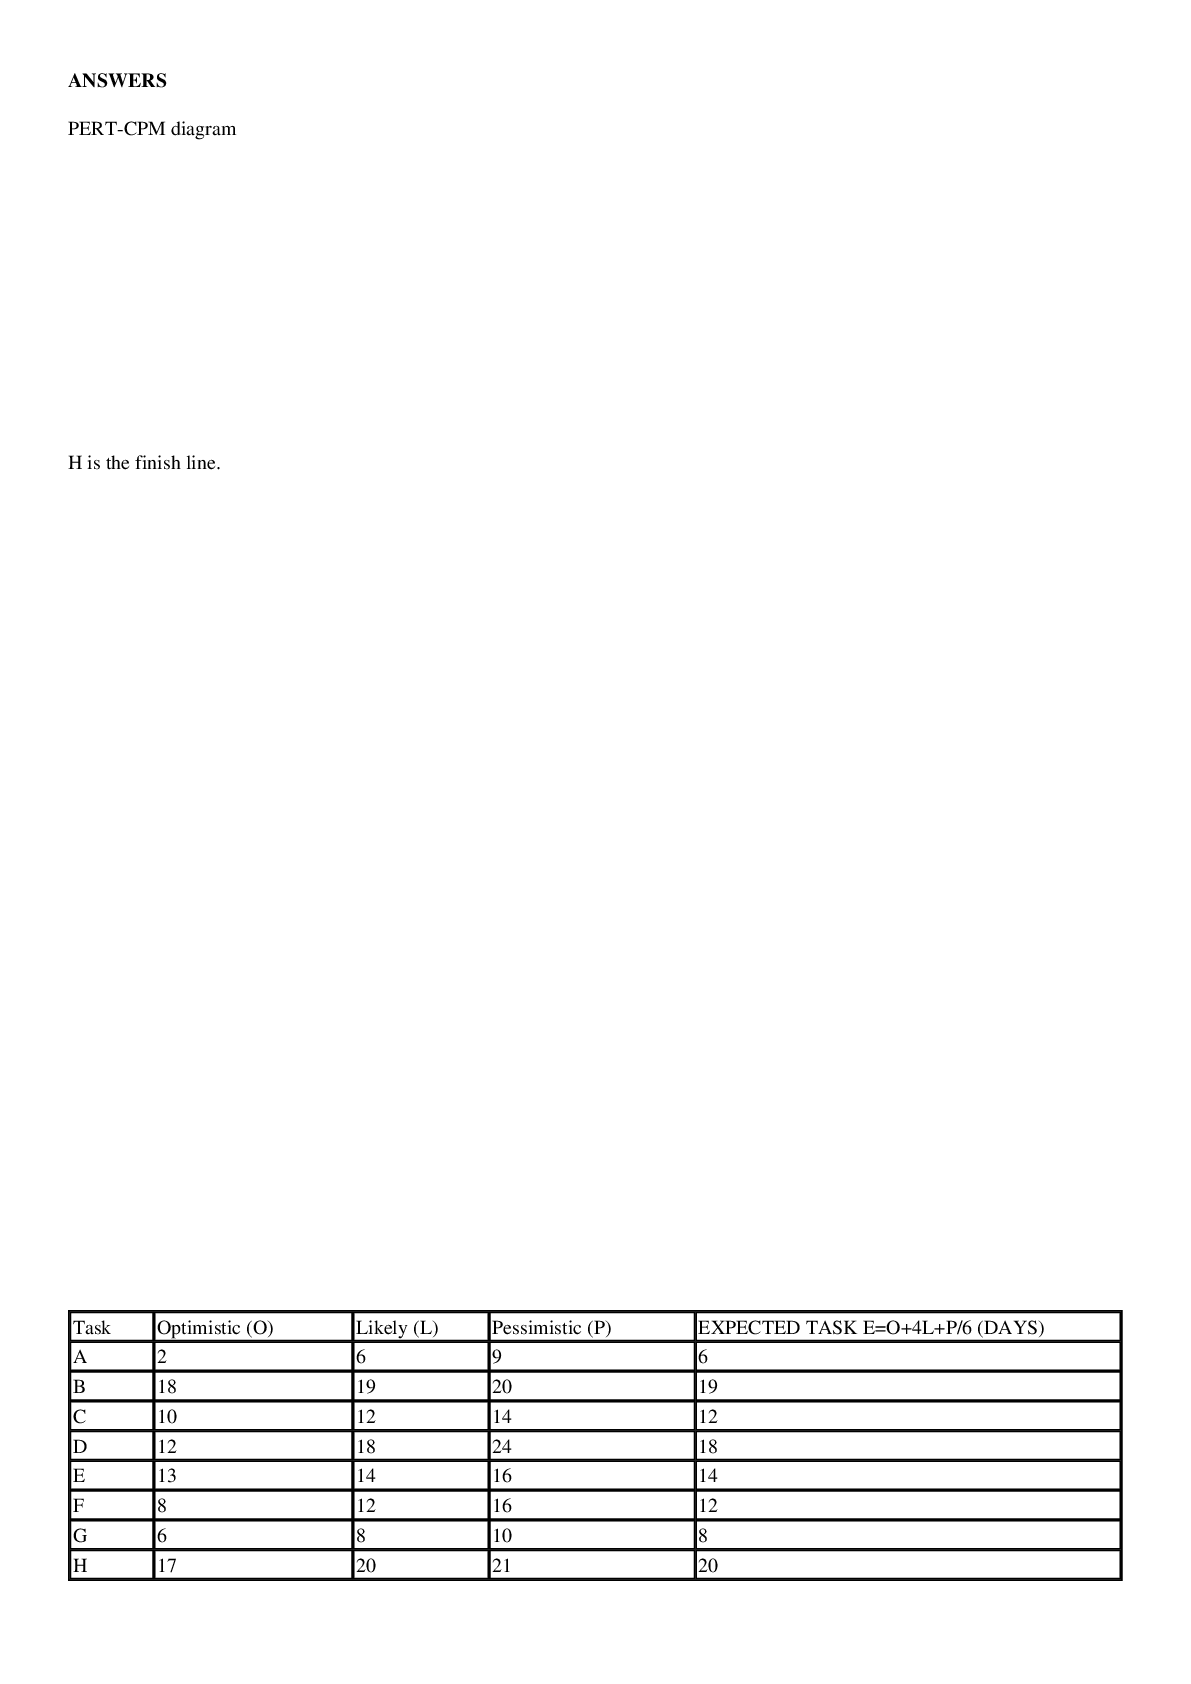
The last task is H. It has two predecessors, F and G. After H is finished, the project itself is
finished. We arrive at the End, which doesn’t have any time associated with it. It’s just the finish
line.
[Show Less]