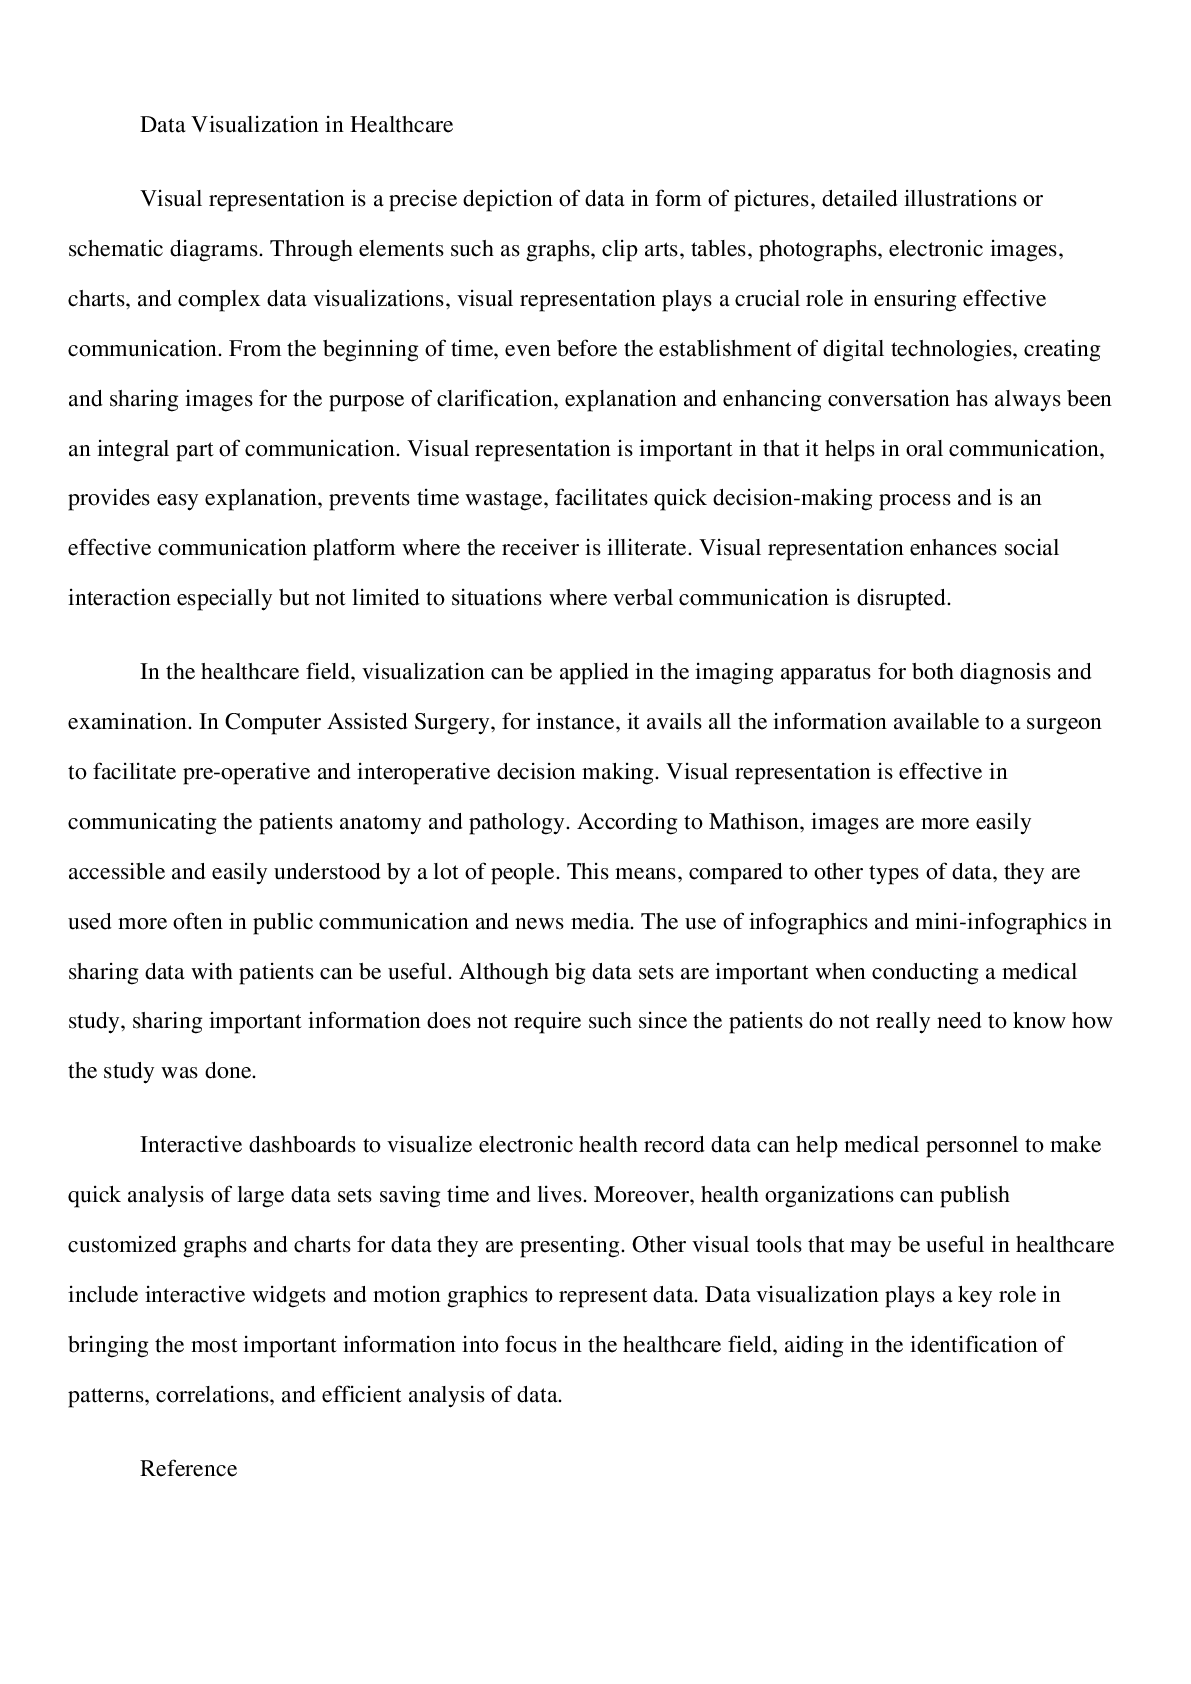

Describe how visual representations of data are used on a daily basis to communicate information; think about graphs or charts you have seen on utility bills, or in a brochure or on a poster. Knowing how data visualization can be used in our daily lives, how can it be applied in the health industry? ...[Show More]
Published: 1 year ago
Published By: Magical Tutors
UON > Discussion Post > Discussion page(s)

Purchase the document to unlock it.
This paper costs $ 3
You may use credit points to purchase the paper. Register below to earn 25 credits. Register Here >>
| Category: | Discussion Post |
| Published By: | Magical Tutors |
| Published On: | 1 year ago |
| Number of pages: | 1 |
| Language: | English |
You may use credit points to purchase the paper. Register below to earn 25 credits. Register Here >>